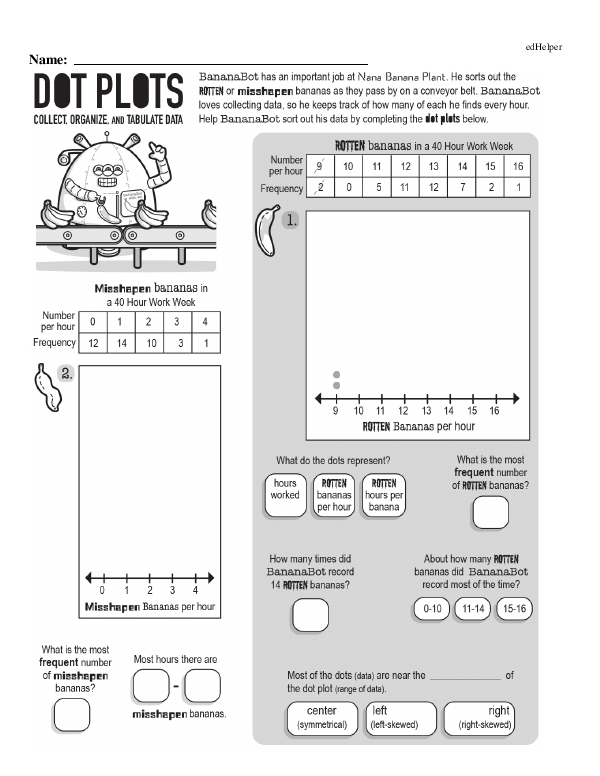
This math chapter workbook on statistics covers several foundational concepts to build students' understanding of data analysis. The chapter begins with practicing the basics of data collection and organization. Students should know how to represent data using various methods, such as tables, line plots, and bar graphs. The teacher should also introduce measures of central tendency, including mean, median, and mode, along with measures of variability, such as range. The workbook focuses on interpreting data by analyzing graphs and charts, identifying patterns or outliers, and making predictions based on data trends.
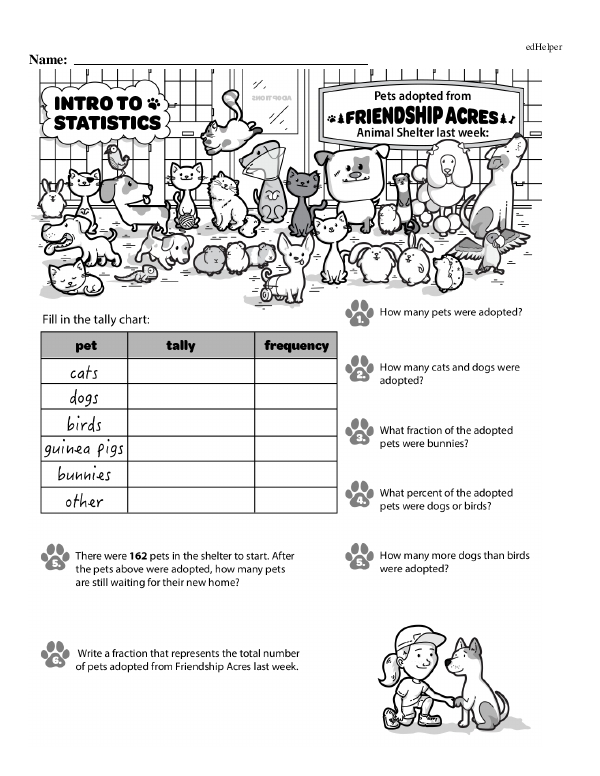
A lesson could complement this workbook with a simple class survey. The teacher could start by asking students to suggest topics of interest, such as favorite fruits, pets, or hobbies. Once the data is collected, the class can collaborate to organize the information on the board. The teacher can guide students in interpreting the data and discussing which categories were most and least popular. To reinforce the lesson, students can create graphs or pie charts.
Statistics (Math Chapter Workbook)
Statistics (Math Chapter Workbook)
Comprehensive Math Workbook: 21+ Pages of MasteryGRADES:
More Workbooks:
Book #1: Unleashing the Power of Data: Stat-tastic Workbook
Data Large Workbook - (Grade 6)