This math chapter workbook on "Picture Graphs and Bar Graphs" focuses on introducing basic data representation concepts through simple and engaging activities. Teachers can help by explaining the purpose of graphs, emphasizing how they help organize and display data visually to make it easy to understand and compare. This can involve real-life scenarios, such as counting favorite fruits or types of pets in the class. This workbook introduces bar graphs, highlighting using bars to represent quantities.
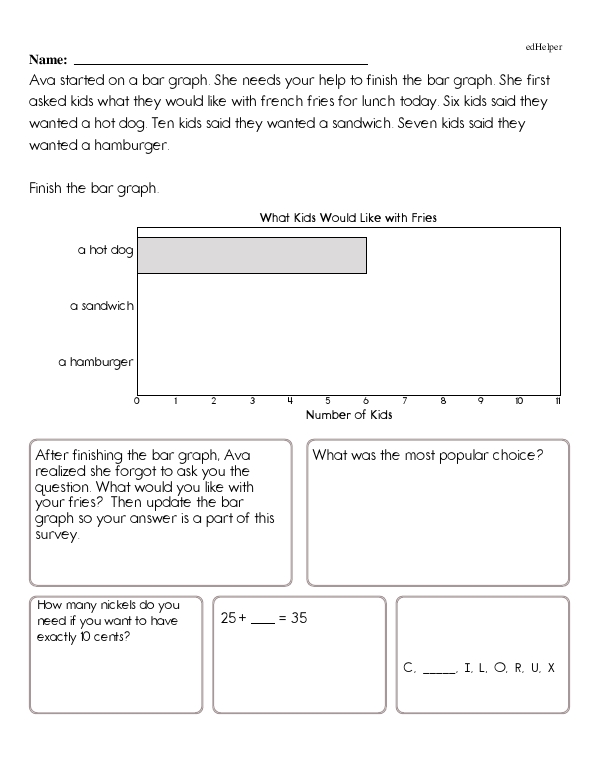
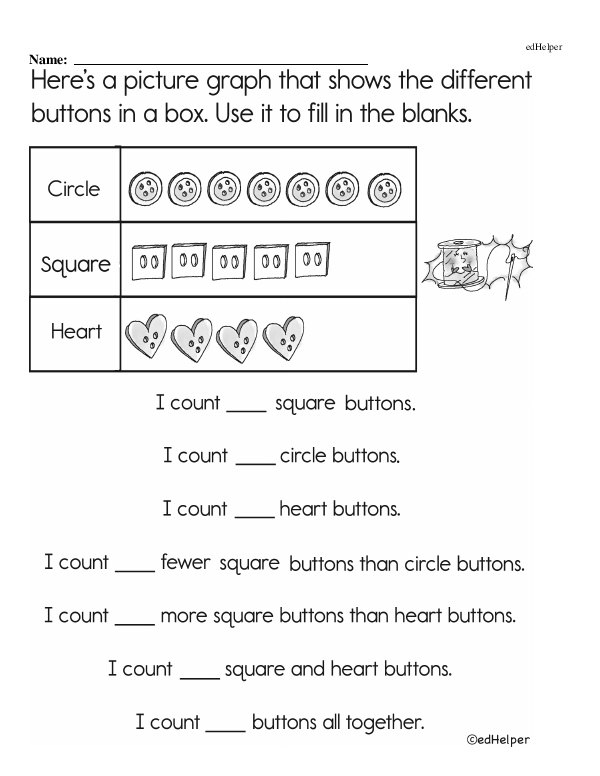
Students might encounter problems such as interpreting a picture graph that shows different fruits with corresponding images (e.g., 5 apples, 3 bananas, and 4 oranges represented by pictures of each). A question might be, "How many more apples are there than bananas?" To solve this, students count the apple images and banana images and then subtract the smaller number from the larger one to find the difference. Another example is a basic bar graph showing the number of students with different favorite colors. A question like "Which color is the most popular?" would involve identifying the tallest bar. For practice, students might also create their bar graph by collecting data, such as the number of each type of pet owned by their classmates, and then drawing bars to correspond with the data collected, reinforcing both their counting and categorization skills.
Picture Graphs and Bar Graphs (Math Chapter Workbook)
Picture Graphs and Bar Graphs (Math Chapter Workbook)
Dive into Math: Complete Chapter Workbook with Over 17 PagesGRADES:

Additional Educational Resources:
Using Bar Models: Addition and Subtraction Large Workbook - (Grade 3)
Bar Graphs and Line Plots Large Workbook - (Grade 3)
Shapes and Geometry (Grade 1 - Math Assessment)
Picture Graphs and Bar Graphs (Grade 1 - Math Assessment)