This math chapter workbook on "Picture Graphs," covers the basics of data representation using simple picture graphs. This includes teaching students how to interpret data presented in a picture graph format, where symbols or images represent quantities of different categories. Key components of a picture graph are reinforced, such as the title, categories, symbols, and the key or legend that explains what each symbol represents. The teacher should also guide students through creating picture graphs using collected data, ensuring they can organize data logically and use appropriate symbols. To cement understanding, teachers might incorporate activities where students draw conclusions or answer questions based on the data represented in various picture graphs.
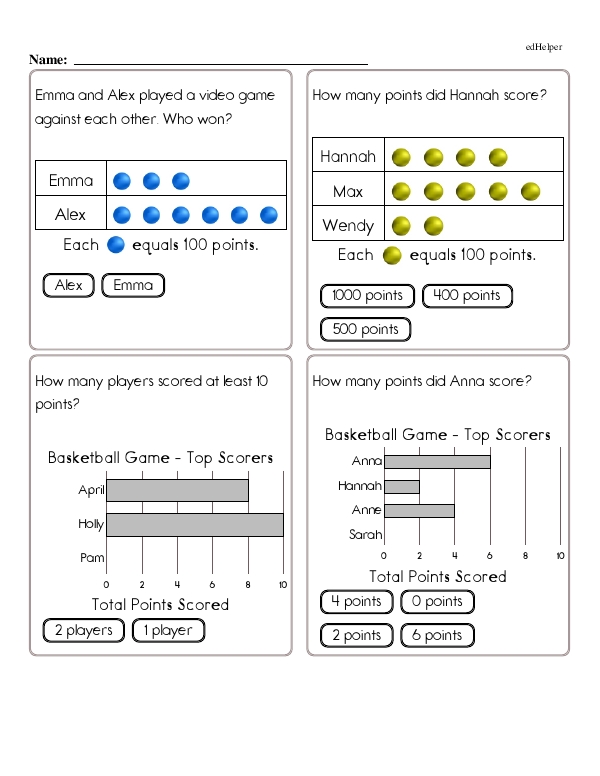
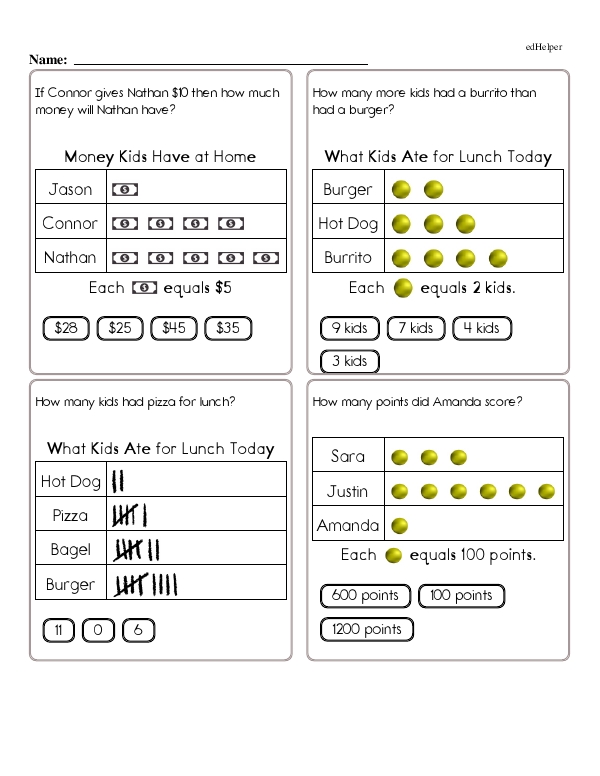
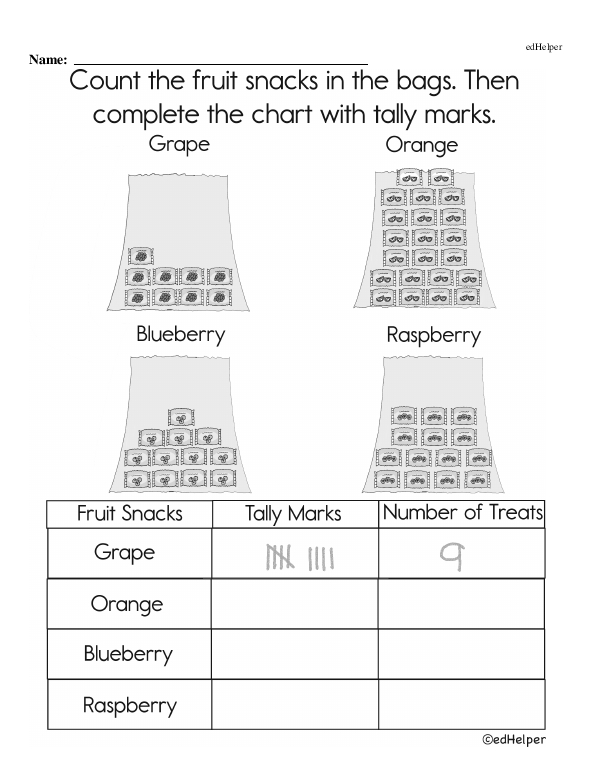
Picture Graphs (Math Chapter Workbook)
Additional Educational Resources:
Using Bar Models: Addition and Subtraction Large Workbook - (Grade 2)
Picture Graphs (Grade 2 - Math Assessment)
Picture Graphs (Math Chapter Workbook)
Math Mastery: 9+ Page Chapter WorkbookGRADES:

Additional Educational Resources:
Using Bar Models: Addition and Subtraction Large Workbook - (Grade 2)
Picture Graphs (Grade 2 - Math Assessment)