Embark on an exciting journey through the world of data organization, ordered pairs, probability, and more! Dive into the captivating realm of line graphs on pages 1 and 2, discovering the power of visual data representation. Explore the intricacies of ordered pairs on pages 3 and 4. Sharpen your analytical skills on page 5 as you delve into calculating combinations. Finally, test your knowledge with engaging probability exercises on pages 6 and 7. Are you ready to tackle them all and unlock the secrets of data and probability?
By the fifth grade, students should learn the basics of graphs to enhance their understanding of data analysis. They should be able to read and interpret data from various types of graphs, such as bar graphs, line graphs, and pie charts, and understand how this data is collected and represented visually. They should also learn to create their own simple graphs.
1. Introduction and Explanation of Graphs: The teacher should explain what a graph is and how it is used to show data visually. This should include discussing different types of graphs (such as bar graphs, line graphs, pie charts, etc.) and when to use each type.
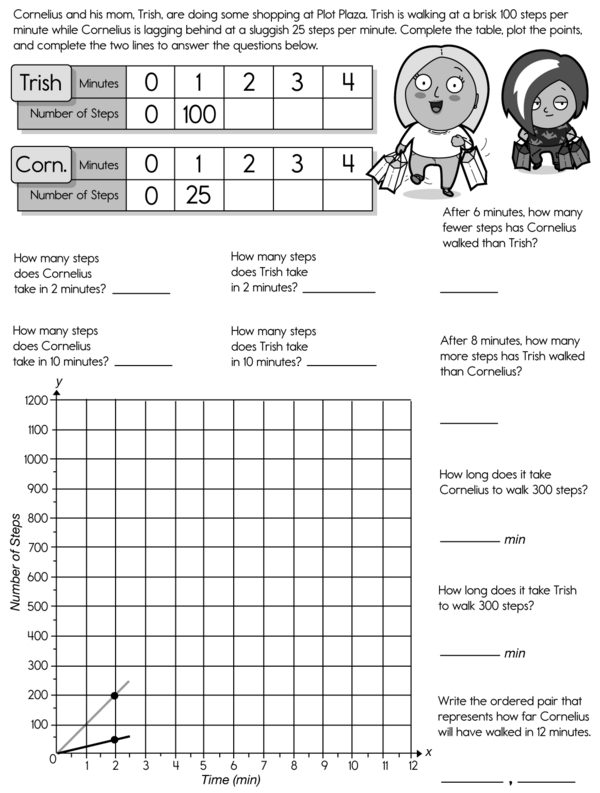
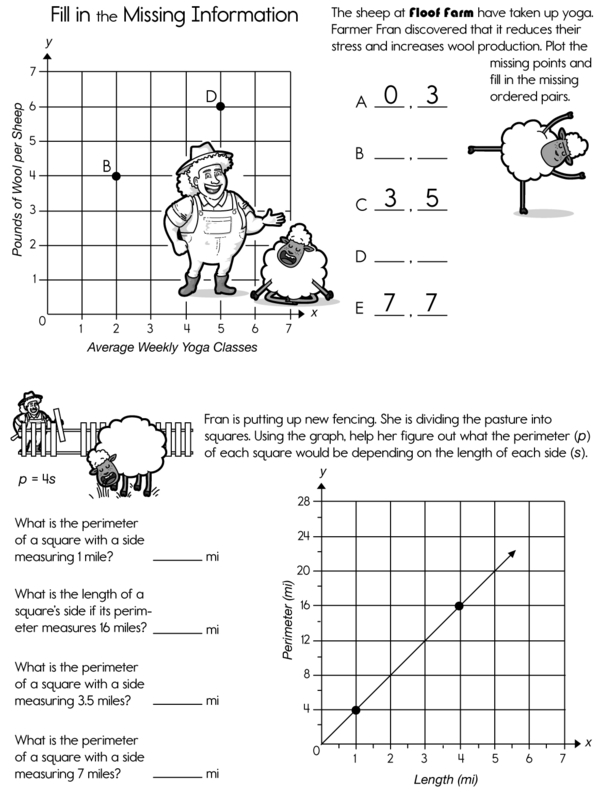
2. Reading and Interpreting Graphs: Students need to know how to gather information from a graph. This involves understanding the x and y-axes, reading plot points, and interpreting the data represented.
3. Creating Graphs: The teacher should guide students in collecting data and creating their own graphs. This process reinforces what each part of a graph represents and how this visual representation of data makes information easier to understand.

Math Explorer's Workbook: Graphs, Probability, and Beyond
Additional Educational Resources:
Graphs and Probability Large Workbook - (Grade 5)
The Coordinate Plane Large Workbook - (Grade 6)
Algebra (Grade 5 - Math Assessment)
Math Explorer's Workbook: Graphs, Probability, and Beyond
GRADES:
Additional Educational Resources:
Graphs and Probability Large Workbook - (Grade 5)
The Coordinate Plane Large Workbook - (Grade 6)
Algebra (Grade 5 - Math Assessment)