What's the best way to handle a lot of data? Organize it! This workbook will teach you how to organize data using tables, bar graphs, and line graphs. Each page presents a new exercise to help you become familiar with these concepts. First, arrange the information so it can be visualized, then answer the questions. Enjoy the practice!
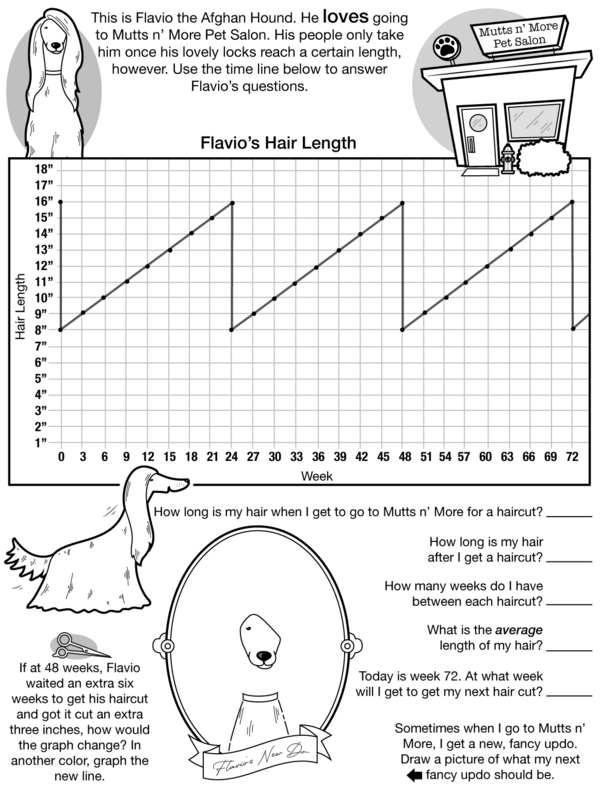
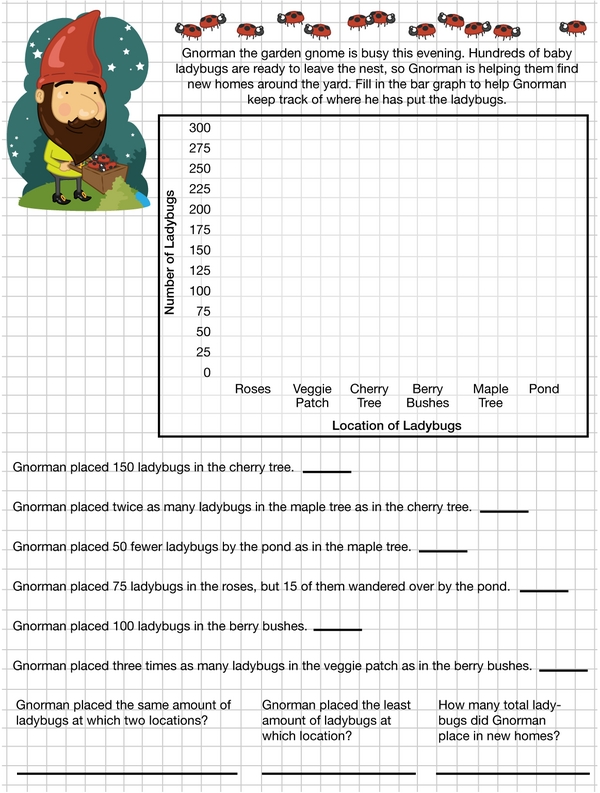
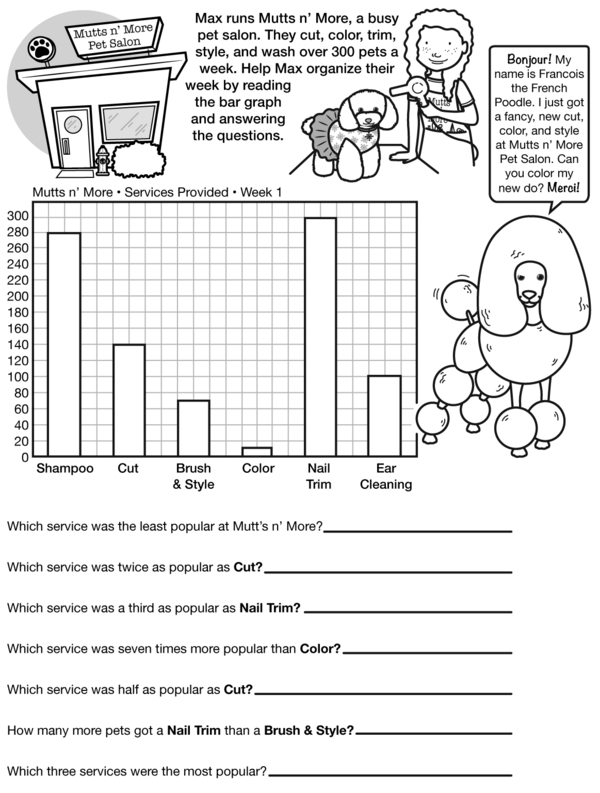
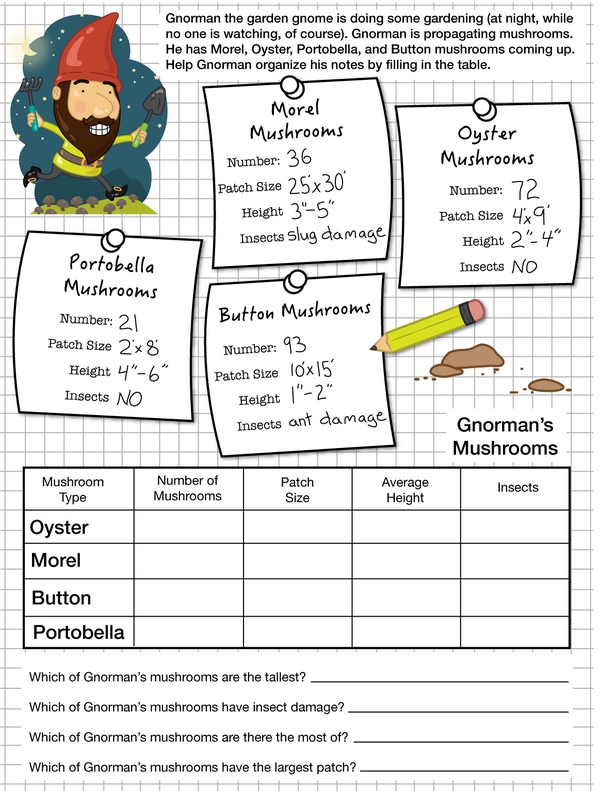
Fourth graders should learn the basics of tables and line graphs, understanding their purpose as visual tools for representing and organizing data. They should learn how to interpret the information presented in such formats, recognize patterns and trends, and make predictions based on the data. In the case of tables, students should understand how to read row by row and column by column, as well as using tables to compare quantities. Line graphs should be introduced as a method to display changes over time, understanding the significance of the horizontal (x-axis) and vertical axis (y-axis). Also, they should learn how to create their own simple tables and line graphs from given data sets. Overall, the goal is for students to develop basic data literacy skills, which are crucial for understanding the world around them.
Gnomes, Pets, and Data Galore: An Organizing Adventure Workbook
Additional Educational Resources:
Bar Graphs and Line Plots Large Workbook - (Grade 3)
Tables and Line Graphs Large Workbook - (Grade 4)
Gnomes, Pets, and Data Galore: An Organizing Adventure Workbook
GRADES:
Additional Educational Resources:
Bar Graphs and Line Plots Large Workbook - (Grade 3)
Tables and Line Graphs Large Workbook - (Grade 4)