This math chapter workbook on "Data" covers a range of fundamental statistics and data handling concepts to build a strong foundation for students. Students will practice interpreting data variability and how outliers can affect data interpretation. Real-world applications and problem-solving exercises are included so students understand the relevance of data handling in everyday situations.
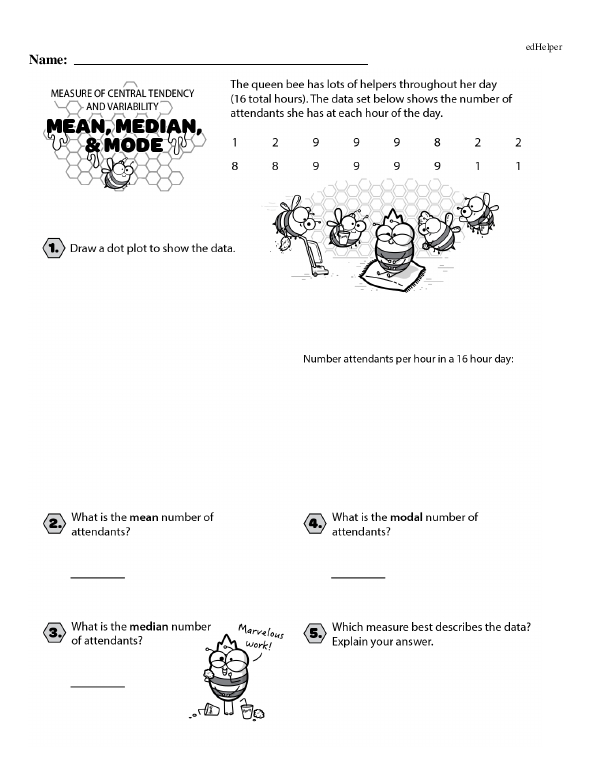
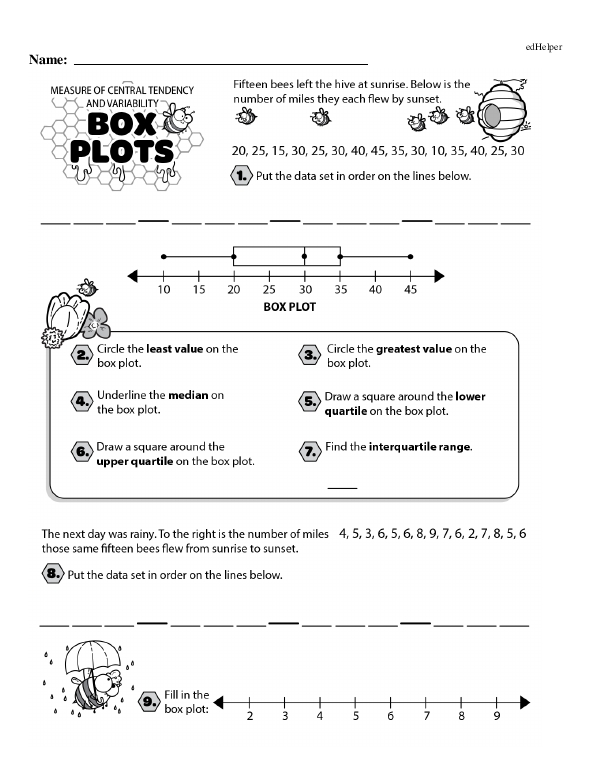
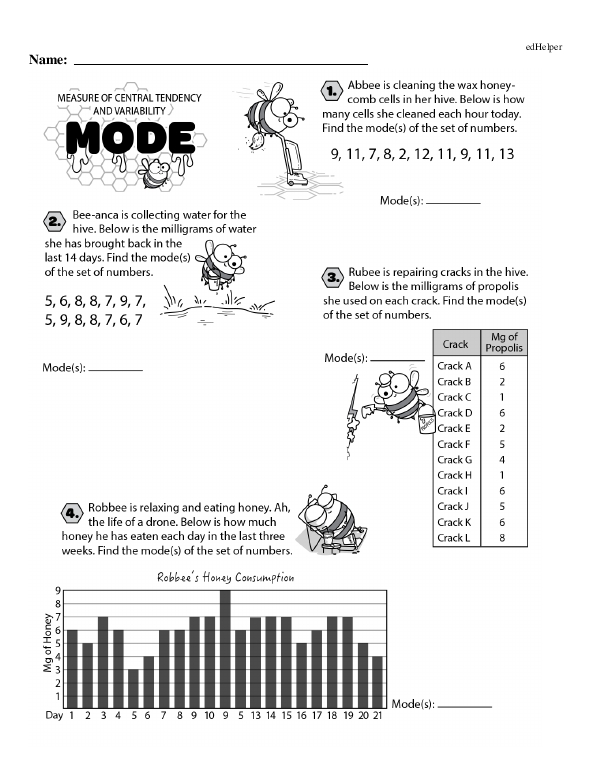
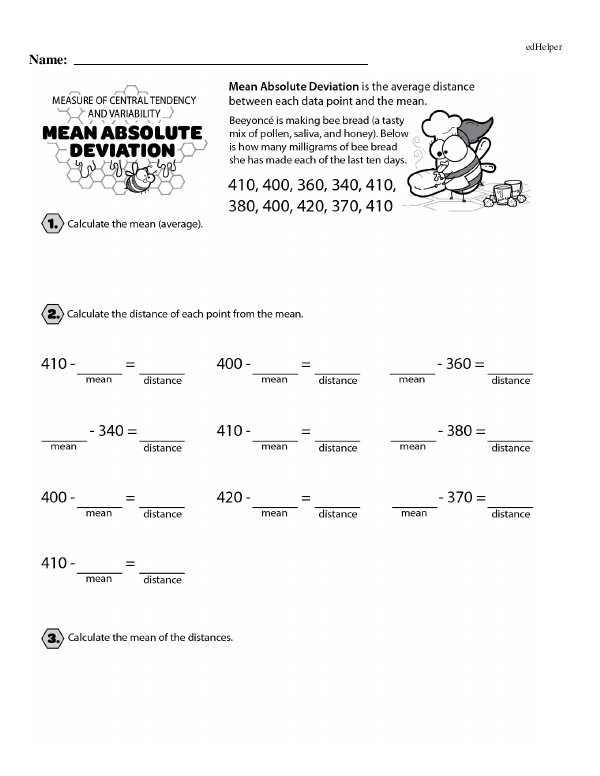
This workbook will help students practice calculating and understanding the concepts of mean, median, mode, range, and mean absolute deviation. They will practice finding the mean by summing up all data points and dividing them by the number of values. They will practice ordering data from least to greatest and identifying the middle value to find the median. They will look for the number that appears most frequently in the data set for mode. The workbook also helps students practice interpreting a box plot that visually displays a data set's distribution. This includes understanding the five-number summary: minimum, first quartile (Q1), median, third quartile (Q3), and maximum.
Data (Math Chapter Workbook)
Data (Math Chapter Workbook)
A Full Chapter Workbook of 16+ PagesGRADES:

More Workbooks:
Book #1: Buzzing Workbook: A Fun Journey Through Mean, Median, and Mode
Statistics Large Workbook - (Grade 6)