
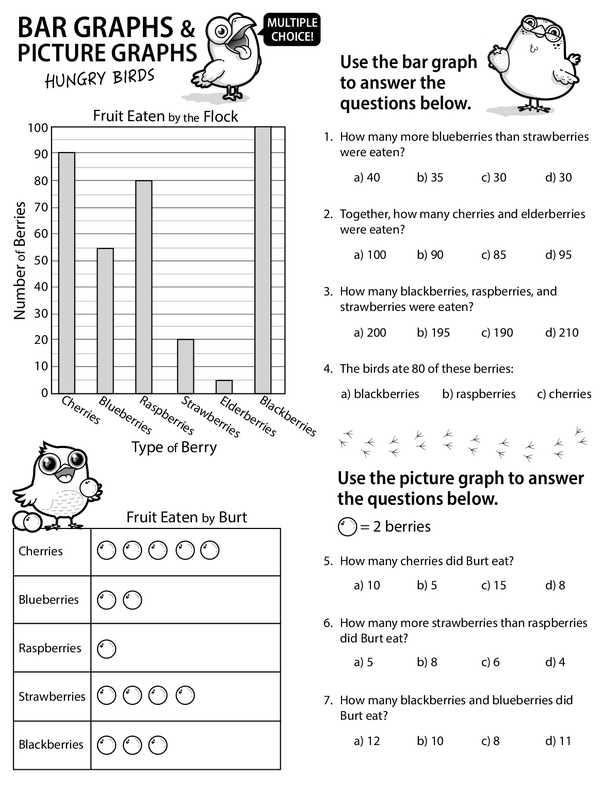
Let's turn statistics into a fun activity! Here's a multiple-choice worksheet that uses both bar graphs and picture graphs. For questions 1-4, look at the bar graph and figure out how much fruit a flock of birds ate. Examine the picture graph on questions 5-7 to determine how much fruit Burt ate. Do you know what the bars and pictures signify? Give this worksheet a try and practice your data interpretation skills. This is a great way to start understanding how data is represented visually and to boost your analytical thinking. Don't be afraid to challenge yourself - interpreting graphs can be fun!
Graphs are used in mathematics to represent data visually. Bar graphs and picture graphs teach children how to interpret and understand data in a measurable way, which boosts their analytical and critical thinking skills. Graphs are not just numbers on a page; they're a window into the real world. From understanding flow charts, infographics, weather patterns, and market trends, graphs are everywhere. Learning to read them is like gaining a superpower that helps you make sense of the world around you.
Bar and Picture Graph Practice - Hungry Birds
Additional Educational Resources:
Bar Graphs and Line Plots Large Workbook - (Grade 3)
Using Bar Models: Addition and Subtraction Large Workbook - (Grade 2)
Picture Graphs (Grade 2 - Math Assessment)
Picture Graphs and Bar Graphs (Grade 1 - Math Assessment)
Math Smash - Addition and Subtraction
Missing Numbers in Hopscotch
Money Addition: A Shopping-Based Exercise for Students
Mastering Greatest Common Factors: Step-by-Step Approach
Bar and Picture Graph Practice - Hungry Birds
GRADES:


Additional Educational Resources:
Bar Graphs and Line Plots Large Workbook - (Grade 3)
Using Bar Models: Addition and Subtraction Large Workbook - (Grade 2)
Picture Graphs (Grade 2 - Math Assessment)
Picture Graphs and Bar Graphs (Grade 1 - Math Assessment)
Math Smash - Addition and Subtraction
Missing Numbers in Hopscotch
Money Addition: A Shopping-Based Exercise for Students
Mastering Greatest Common Factors: Step-by-Step Approach