This math chapter workbook on "Bar Graphs and Line Plots" focuses on key concepts to build a foundational understanding of data representation and interpretation. Using this workbook, students will practice using and analyzing bar graphs and line plots effectively.
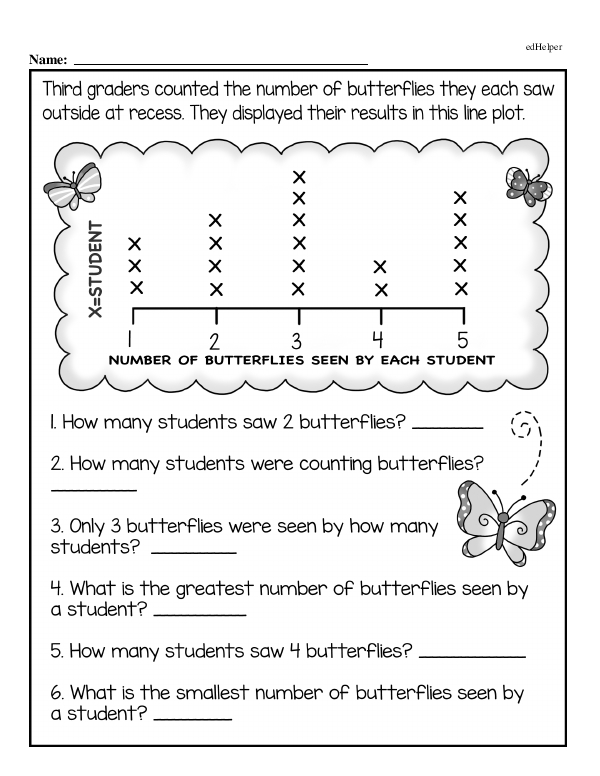
In third grade, students should develop a foundational understanding of bar graphs and line plots. They should learn how to create and read bar graphs by organizing and displaying data using vertical or horizontal bars, with each bar's length representing the frequency or amount of each category. Students should understand how to label axes and choose appropriate scales, ensuring clarity in their data presentation. Similarly, they should become familiar with line plots, which involve placing dots over a number line to indicate the frequency of values in a data set.
Bar Graphs and Line Plots (Math Chapter Workbook)
Bar Graphs and Line Plots (Math Chapter Workbook)
A Full Chapter Workbook of 11+ PagesGRADES:
More Workbooks:
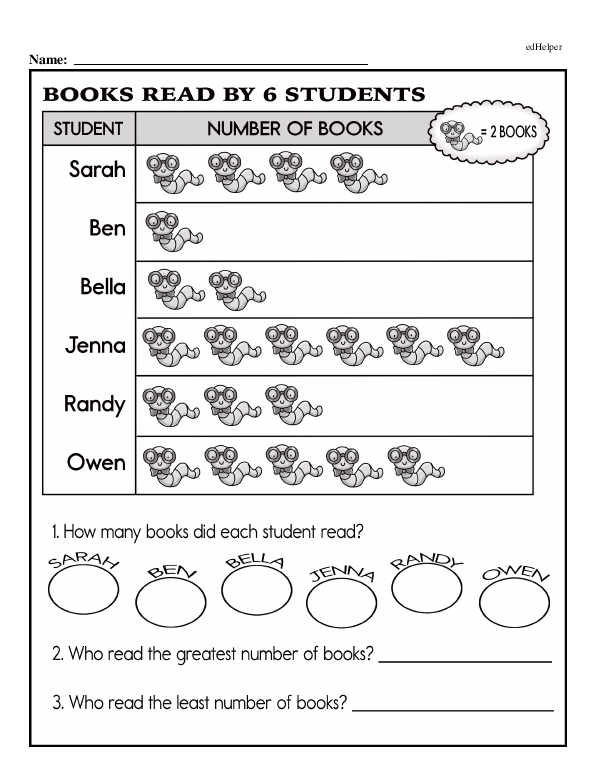
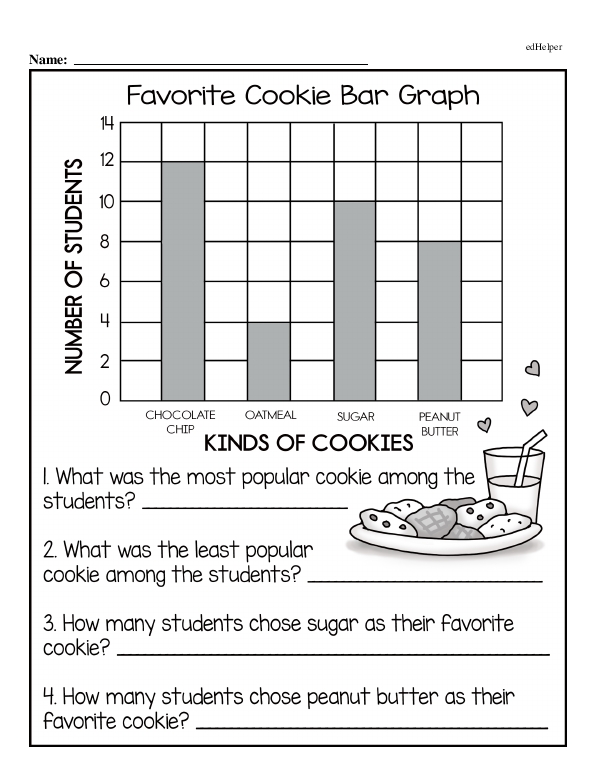
Book #1: Chart It Right: Bar Graphs in Action
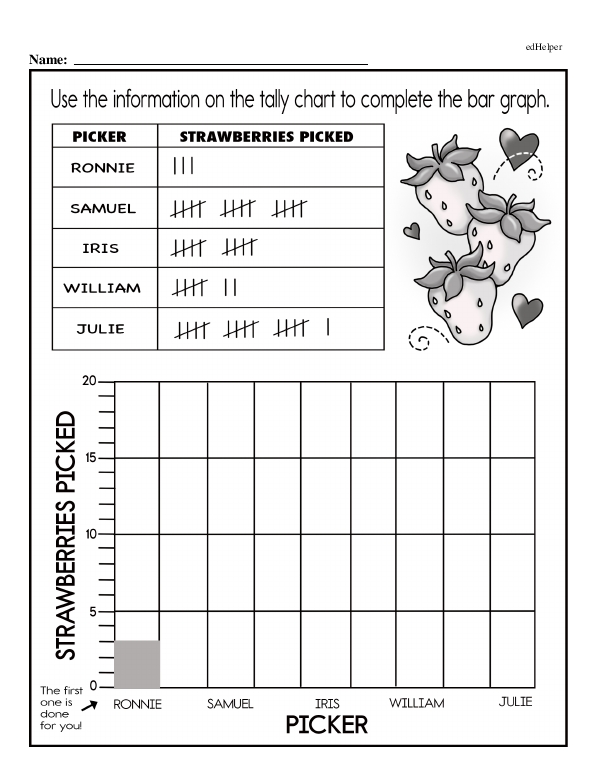
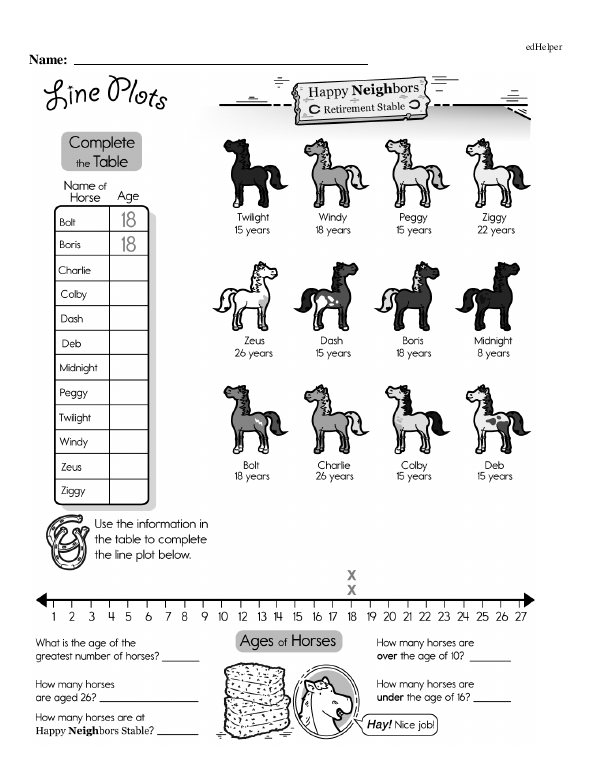
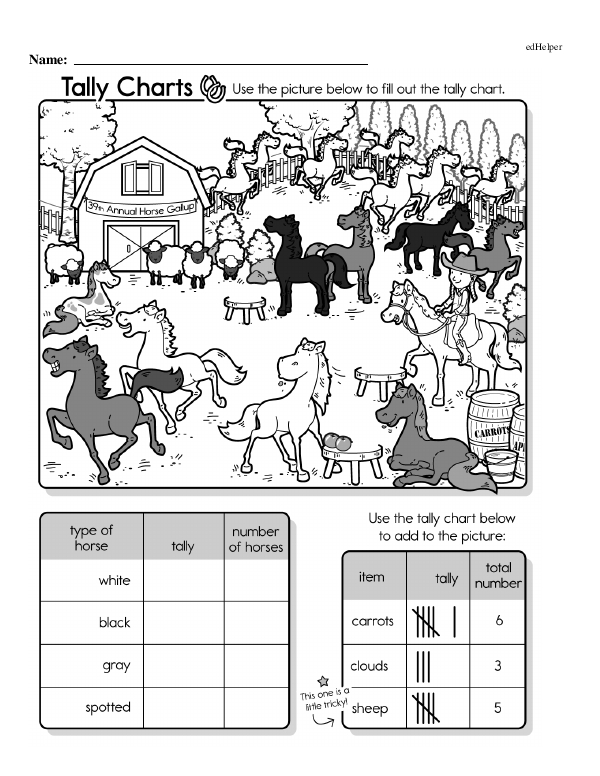
Book #2: Show and Tell: Bar Graphs, Tallies, and Line Plots
Real-World Problems: Measurement Large Workbook - (Grade 3)