Create a new printable
Answer key also includes questions
Answer key only gives the answers
No answer key
   Worksheets and No Prep Teaching Resources
Analyze Data and Graphs
Math Worksheets


Sample - Click above to make a new math worksheet (PDF).
Name _____________________________
Date ___________________
Graphs
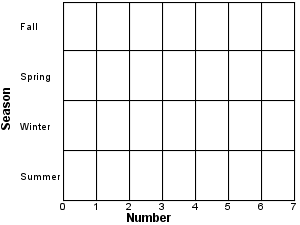
Use data from the tally table to make a bar graph. Answer the questions.

Favorite Season
  Season    Tally    Number  
  Winter        5  
  Spring        3  
  Summer        2  
  Fall        6  

Favorite Season


1.   How many fewer people chose spring than chose fall?

2.   List the seasons in order from the season with the most votes to the season with the fewest votes.

3.   * This is a pre-made sheet.
Use the link at the top of the page for a printable page.
4.   Did more people choose summer or winter?

5.   How many people chose spring as their favorite season?

6.   What is the most popular season?


Answer Key


Sample
This is only a sample worksheet.

Create a new printable
Answer key also includes questions
Answer key only gives the answers
No answer key
   Worksheets and No Prep Teaching Resources
Analyze Data and Graphs
Math Worksheets